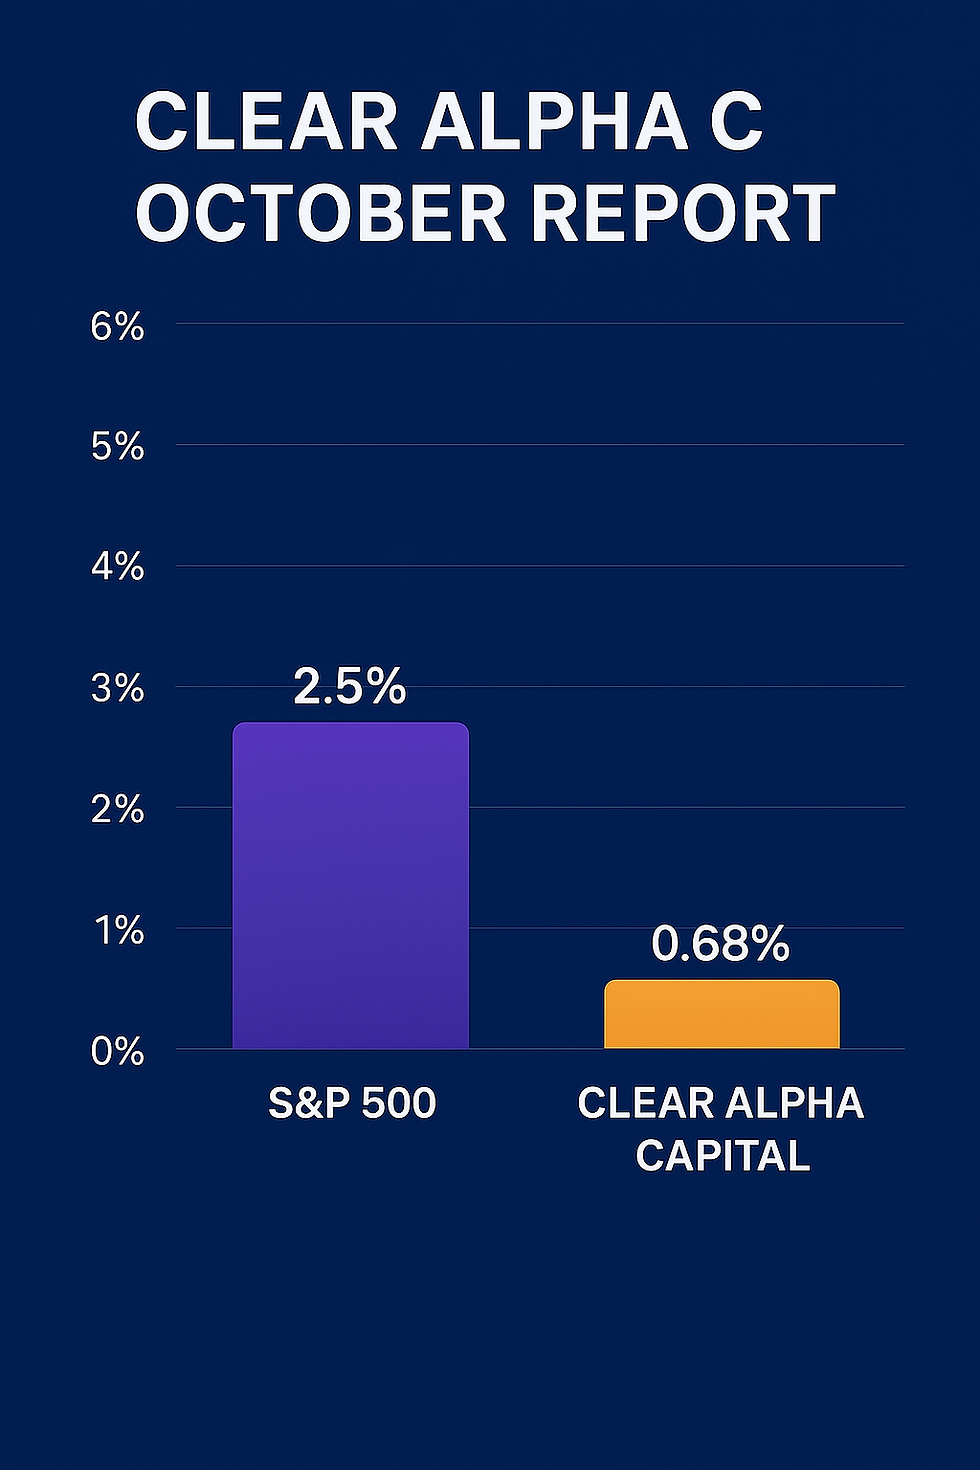
S&P 500 vs. Other Major Assets: Long-Term Return Comparison (2014–2024)
- michael lee
- Aug 8, 2025
- 1 min read

Over the past decade, the U.S. S&P 500 Index has consistently outperformed most traditional investment options. The chart below compares the average annual returns of major asset classes:
Data (Average Annual Return, 2014–2024):
- S&P 500 Index: 10.6%
- U.S. Residential Real Estate: 5.6%
- Gold (USD): 4.1%
- U.S. 10-Year Treasury Bonds: 1.9%
- Savings Accounts (Major Currencies): 0.8%
- Bitcoin: Extremely volatile (not suitable for long-term conservative investing)
Summary:
For investors seeking long-term compounded growth and inflation resistance, the S&P 500 remains one of the most attractive core allocations globally.
Follow ClearAlpha Capital — we specialize in showcasing U.S. equity portfolio strategies. This platform does not provide investment advice or asset management. All content is for educational and research display purposes only.

![F4COf14wLxNLZGtbmcnYQ2c1NK4[1].jpg](https://static.wixstatic.com/media/771a96_df5360b7a1b34b5699dc57c6aba9e7ba~mv2.jpg/v1/fill/w_719,h_719,al_c,q_85,usm_0.66_1.00_0.01,enc_avif,quality_auto/771a96_df5360b7a1b34b5699dc57c6aba9e7ba~mv2.jpg)


Comments